


A good infographic turns dry text into something people actually want to read. With Gemini 3 and Nano Banana Pro, you no longer need a design degree to get there. A Gemini 3 Nano Banana Pro infographic can carry a headline, charts, icons and long text while still looking clean enough for a marketing site or a boardroom slide.
This article works as a complete Nano Banana Pro infographic tutorial, from the first outline to export. You can use the same process for marketing posters, social media visuals, data dashboards and business decks that support your next presentation.
What Is Nano Banana Pro in Gemini 3 and How to Use It?
Nano Banana Pro lives inside Gemini 3 as a higher tier image model that understands layout, typography and content-heavy graphics. In simple terms, it knows how a poster or slide should look.
Instead of only drawing pretty illustrations, it can handle headlines, paragraph text, captions, icons and charts in a single frame. That is why a Gemini 3 Nano Banana Pro infographic often feels much closer to a real design file than a random AI image.
You can rely on it for:
- Marketing one-pagers and launch visuals
- Slide-style images with bullets and charts
- Long social graphics with sections and CTAs
- Blog header infographics that summarise an article
It especially shines with any image that needs both strong visuals and a lot of readable text.
How to use Nano Banana Pro in Gemini 3 (UI & basic steps)
Using it inside Gemini stays simple. You choose the Gemini 3 model that includes Nano Banana Pro, open a chat, then describe the infographic you want. The model reads your prompt, plans a layout, and returns a finished visual. You can then ask for edits, run new prompts, or export the final result.
In this guide, we'll focus on how to make infographics with Nano Banana Pro without needing any design background.
Step-by-Step: How to Make Infographics with Nano Banana Pro
Step 1 - Turn your outline into a clear prompt
Start with a simple outline in plain text. Decide on a title, three or four sections, and one key metric or quote. Then convert that outline into a prompt.
Here's how to create infographic with Nano Banana Pro using a structured, copy-and-paste prompt:
- Topic
- Target audience
- Number of sections
- Main numbers that must appear
- Preferred style and colours
- Aspect ratio, for example 16:9 for slides or 4:5 for Instagram
-
You can even paste a short bullet list and ask Gemini 3 to rearrange it into a better structure before you move to visuals.
Step 2 - Generate your first Gemini 3 Nano Banana Pro infographic
Once your prompt feels clear, ask Gemini 3 to create the first version. Pay attention to the basics first. Text should be sharp and easy to read, section titles should stand out, and colours should match your brand or campaign mood.
Look at the hierarchy of elements. The hero number or headline belongs at the top or centre. Supporting text should sit in neat blocks. A Gemini 3 Nano Banana Pro infographic tends to give you a clear grid by default, so small tweaks usually solve most layout issues.
Step 3 - Refine layouts, colors, and text with follow-up prompts
After the first draft, treat Nano Banana Pro as a designer who takes short, direct feedback. Ask it to:
- Change the background to a darker or lighter shade
- Swap the accent colour
- Turn a long paragraph into three bullets
- Increase the size of a key number or chart
-
You can also request alternative layouts for A/B tests or different platforms. One version may suit a landing page header, another works better on Pinterest.
Step 4 - Export and prepare assets for web, slides, or print
When the design looks right, export it as PNG or WebP in a resolution that matches the final channel. A wide version fits a slide deck or blog header. A square or vertical crop helps on social media.
Sometimes you want to composite elements or drop the infographic onto another background. In that case, clean edges save a lot of time. You can remove backgrounds from icons or product shots before you place them into Nano Banana Pro prompts. A quick way is to use a background remover such as PixPretty.
Then bring the cut-out visual back into your prompt or into your design tool.
Once you know how to make infographics with Nano Banana Pro, you can reuse the same workflow for many different topics and campaigns.
Ready-to-Use Prompts to Create Infographic with Nano Banana Pro
Community examples on Reddit already show complex entropy charts and multi-section layouts created with Nano Banana Pro. You can achieve similar results without much trial and error by starting from a small prompt library.
| Photo | Prompt | Copy |
|
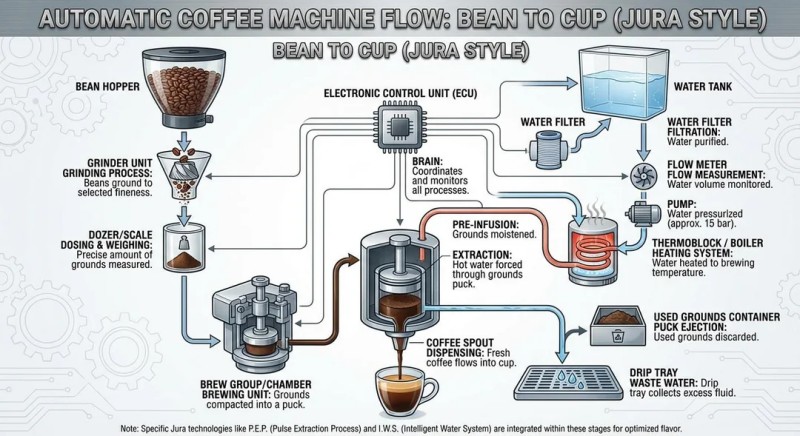
Create a detailed Infographic of the functioning and flow of an automatic coffee machine like a Jura. From bean basket, to grinding, to scale, water tank, boiler, etc. I’d like to understand technically and visually the flow.
|
COPY
|
|
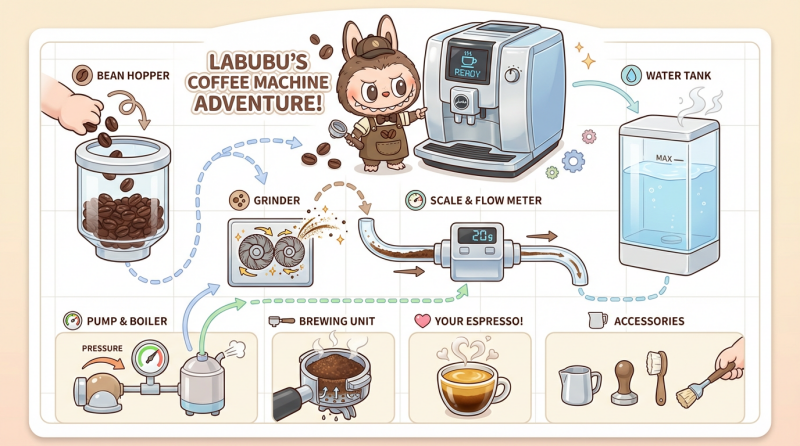
Create a detailed infographic featuring Labubu operating an automatic coffee machine (similar to a Jura). Show the full technical flow from bean hopper to finished espresso in a cute, collectible-figure style. Include: Bean basket / hopper with coffee beans Internal grinder with flying coffee particles Scale / flow meter Water tank Pump and boiler Brewing unit / portafilter Cup with espresso and crema Use a clean, technical layout with arrows, icons, and clearly labeled parts, but keep the overall style adorable and toy-like, as if it’s a Labubu barista instruction poster. White or light background, soft pastel colors, minimal text labels in English, top-down cutaway views and small close-up panels for each step.
|
COPY
|
|
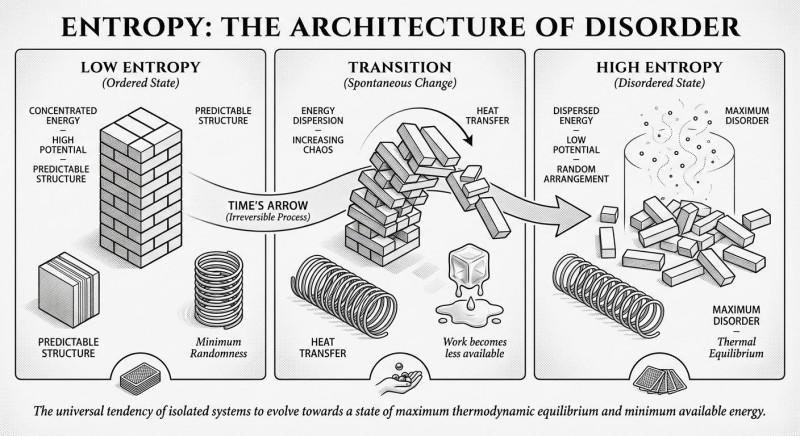
Make an infographic about entropy in black and white, elegant
|
COPY
|
Use this table as a base when you create infographic with Nano Banana Pro.
| Theme | Prompt | Copy |
|
General marketing infographic prompt |
"Create a Gemini 3 Nano Banana Pro infographic that explains our marketing funnel to new leads. Use a clear headline, three sections (Awareness, Consideration, Conversion) and one key metric in each section. Keep the style clean and modern, with our brand colours and enough white space for a website hero image."
|
COPY
|
|
Product launch or feature update infographic |
"Design an infographic with Nano Banana Pro that announces a new product feature. Include a big title, a short 'What's new' block, three benefit icons, and a closing CTA. Use high contrast colours and large text so it works both on landing pages and in email headers."
|
COPY
|
|
Data-driven performance infographic |
"Create a Nano Banana Pro data visualization infographic that summarises our quarterly performance. Show revenue growth in a line chart, channel breakdown in a small bar chart, and three headline KPIs at the top. Prepare it as a wide image ready for a Gemini 3 infographic for marketing reports."
|
COPY
|
|
Social media carousel / multi-panel infographic |
"Create social media infographic with Nano Banana Pro as a four-panel carousel. Panel 1 shows the main claim, Panels 2 and 3 show supporting stats with simple charts, Panel 4 shows a call to action and URL. Use bold typography and layouts that stay readable on a small phone screen."
|
COPY
|
You can adapt each prompt for a specific audience or vertical and still keep the same structure.
FAQs - How to Make Infographic with Nano Banana Pro in Gemini 3
Do I need design skills to make infographics with Nano Banana Pro?
Strong design skills help, but they are not required. Clear content and a structured prompt already take you a long way. The model handles layout, typography and balance for you.
What's the easiest way to start if I've never created an infographic before?
Begin with a simple outline in a text document. Group related ideas, then turn each group into a short section. Follow this Nano Banana Pro infographic tutorial and start from a simple outline. Once that feels natural, add charts or extra sections.
Can Nano Banana Pro handle complex charts and diagrams?
It can handle several charts in a single frame, along with connectors and arrows. To keep control, describe each chart type and the labels it needs. Refer back to the Nano Banana Pro chart and diagram prompts in this article for patterns that work well.
What's the difference between a Gemini 3 Nano Banana Pro infographic and one made with other AI tools?
Text clarity, chart layout and ease of iteration often stand out. A Gemini 3 Nano Banana Pro infographic tends to keep headings legible and charts tidy, which matters for stakeholder trust. As noted earlier, this is a key point when you compare Nano Banana Pro vs other AI infographic generators.
How do I optimize my prompts for business and marketing reports?
Use numbered metrics, time ranges and clear labels. Mention your audience, for example sales leadership or investors. An AI prompt for business infographic in Nano Banana Pro should state the purpose, the key numbers and the chart types. This approach works well for any Gemini 3 infographic for marketing reports and helps you stay on message.
Conclusion - Turn Any Idea into an Infographic with Nano Banana Pro and Gemini 3
You now know how to make infographic with Nano Banana Pro in Gemini 3 from the first outline to the final export. The process stays almost the same whether you build a slide header, a social carousel, a quarterly report summary or a product launch poster.
Start with a clear idea, write a structured prompt, let Nano Banana Pro propose a layout, then refine through short feedback messages. Over time you build your own prompt library and produce consistent visuals for every campaign.
PixPretty AI Photo Editor
- 100% free AI Image Generator (Nano Banana 2 powered)
- 4K image quality with fast generation speed
- AI effects & filters for personal and e-commerce use


